4. Tutorial: Create iML1515 GECKO with manually adjusted turnover numbers
In the previous tutorial we created a GECKO model of iML1515 with TurNuP predicted turnover numbers for metabolic reactions in a few simple steps. The model predictions of protein concentrations are still not satisfactory, e.g. the model predicts high protein concentrations where the measured values are very low and vice versa.
To achieve high prediction quality, a GECKO must be constructed using apparent turnover numbers that account for in vivo conditions such as enzyme regulation, enzyme saturation, and substrate channeling (Araiza-Olivera et al., 2013). TurNuP predicted turnover numbers can only give approximate values. The deviation between predicted and measured data is estimated to be a factor of 4.8. Furthermore, the quality of the training data is poor, consisting mainly of in vitro measurements using enzymatic assays. Measurement points are scarce, highly noisy, and acquired in a non-standardized manner using enzyme-specific assay protocols.
Compared to enzymatic assays, quantitative proteomics is a fairly standardized procedure with almost complete protein coverage. This justifies the use of quantitative proteomics to adjust predicted turnover numbers to apparent turnover numbers, as required for the GECKO model.
In this tutorial, we attempt to improve protein predictions by selectively adjusting turnover numbers. This requires a more detailed analysis of the optimization results combined with a certain amount of organism specific knowledge. We will analyze predicted flux distributions and try to redirect fluxes to physiologically relevant pathways. We will selectively compare predicted to measured protein levels and adjust GECKO coupling factors by modifying turnover numbers. Our focus will be on the major carbon metabolism. The methods and code snippets provided can be used to adjust other parts of the model as well.
Peter Schubert, Heinrich-Heine University Duesseldorf, Institute for Computational Cell Biology (Prof. Dr. M. Lercher), January, 2025
Step 1: Initial setup
[1]:
# Required imports and model names
import os
import re
import pandas as pd
import cobra

from f2xba import XbaModel, EcModel
from f2xba import EcmOptimization, EcmResults
from f2xba.utils.mapping_utils import load_parameter_file, write_parameter_file

fba_model = 'iML1515'
baseline_model = 'iML1515_predicted_GECKO'
target_model = 'iML1515_manual_adjust_GECKO'
reference_cond = 'Glucose'

# Create media conditions
media_grs = {'Acetate': ['ac', 0.29], 'Glycerol': ['glyc', 0.47], 'Fructose': ['fru', 0.54],
             'L-Malate': ['mal__L', 0.55], 'Glucose': ['glc__D', 0.66], 'Glucose 6-Phosphate': ['g6p', 0.78]}
base_medium = ['ca2', 'cbl1', 'cl', 'co2', 'cobalt2', 'cu2', 'fe2', 'fe3', 'h2o', 'h', 'k', 'mg2',
               'mn2', 'mobd', 'na1', 'nh4', 'ni2', 'o2', 'pi', 'sel', 'slnt', 'so4', 'tungs', 'zn2']
conditions = {}
exp_grs = {}
for cond, (carbon_sid, exp_gr )in media_grs.items():
    conditions[cond] = {f'EX_{sidx}_e': 1000.0 for sidx in base_medium}
    conditions[cond][f'EX_{carbon_sid}_e'] = 1000.0
    exp_grs[cond] = exp_gr
print(f'{len(conditions)} minimal media conditions created for simulation')

# Load proteomics
fname = os.path.join('data', 'Ecoli_Schmidt_proteomics.xlsx')
with pd.ExcelFile(fname) as xlsx:
    df_mpmf = pd.read_excel(xlsx, sheet_name='proteomics', index_col=0)
    print(f'{len(df_mpmf)} records of proteomics loaded from {fname}')
min_confidence_level = 43.0
df_mpmf = df_mpmf[df_mpmf['confidence'] > min_confidence_level]
print(f'{len(df_mpmf)} records with confidence level above {min_confidence_level}')
6 minimal media conditions created for simulation
2347 records of proteomics loaded from data/Ecoli_Schmidt_proteomics.xlsx
2232 records with confidence level above 43.0
Step 2: Analyze baseline GECKO model (cobrapy)
First, we need to identify deficiencies in our baseline GECKO model. Using Escher maps, we can visualize predicted flux distributions. By applying organism specific knowledge and comparing predicted to measured protein levels, we can visually identify pathways and reactions where predictions appear to be incorrect. Our focus will be on the major carbon metabolism for the glucose medium, the chosen reference condition.
[2]:
# Load model using cobrapy
fname = os.path.join('SBML_models', f'{baseline_model}.xml')
ecm = cobra.io.read_sbml_model(fname)
total_protein = ecm.reactions.get_by_id('V_PC_total').upper_bound

eo = EcmOptimization(fname, ecm)
sigma = eo.avg_enz_saturation
all_genes = set(eo.m_dict['fbcGeneProducts']['label'].values)
tx_genes, metab_genes = eo.get_tx_metab_genes()
print(f'total modeled protein: {total_protein:.2f} mg/gDW, enzyme saturation level: {sigma}')
print(f'{len(all_genes)} genes: ({len(tx_genes)}) transporter, ({len(metab_genes)}) metabolic')
Set parameter Username
Set parameter LicenseID to value 2731209
Academic license - for non-commercial use only - expires 2026-10-31
SBML model loaded by sbmlxdf: SBML_models/iML1515_predicted_GECKO.xml (Thu Nov 20 18:56:05 2025)
total modeled protein: 306.59 mg/gDW, enzyme saturation level: 0.68
1494 genes: (492) transporter, (1002) metabolic
[3]:
# Optimize model using cobrapy and extract results
pred_results = {}
for cond, medium in conditions.items():
with ecm as model:
model.medium = medium
solution = model.optimize()
if solution.status == 'optimal':
gr = solution.objective_value
pred_results[cond] = solution
print(f'{cond:25s}: pred gr: {gr:.3f} h-1 vs. exp {exp_grs[cond]:.3f}, '
f'diff: {gr - exp_grs[cond]:6.3f}')
else:
print(f'{cond} ended with status {solution.status}')
# Analyze results
er = EcmResults(eo, pred_results, df_mpmf)
df_fluxes = er.collect_fluxes()
df_net_fluxes = er.collect_fluxes(net=True)
df_proteins = er.collect_protein_results()
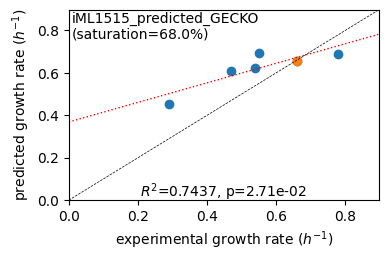
er.plot_grs(exp_grs, highlight=reference_cond)
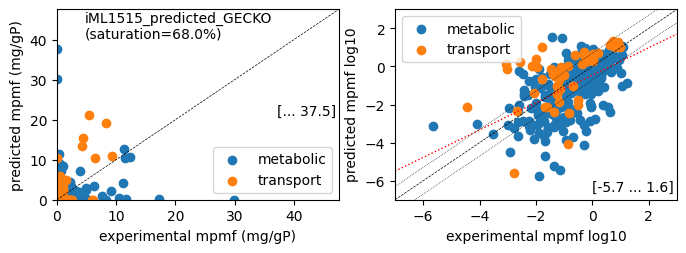
print(f'Protein mass fractions:')
er.report_proteomics_correlation(scale='lin')
er.report_proteomics_correlation(scale='log')
print()
er.report_protein_levels(reference_cond)
er.plot_proteins(reference_cond)
er.save_to_escher(df_net_fluxes[reference_cond], os.path.join('escher', target_model))
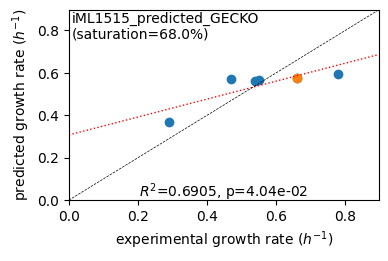
Acetate                  : pred gr: 0.453 h-1 vs. exp 0.290, diff:  0.163
Glycerol                 : pred gr: 0.609 h-1 vs. exp 0.470, diff:  0.139
Fructose                 : pred gr: 0.625 h-1 vs. exp 0.540, diff:  0.085
L-Malate                 : pred gr: 0.695 h-1 vs. exp 0.550, diff:  0.145
Glucose                  : pred gr: 0.653 h-1 vs. exp 0.660, diff: -0.007
Glucose 6-Phosphate      : pred gr: 0.691 h-1 vs. exp 0.780, diff: -0.089
Protein mass fractions:
Acetate : r² = 0.0286, p = 7.71e-08 ( 999 proteins lin scale)
Glycerol : r² = 0.0433, p = 3.17e-11 ( 999 proteins lin scale)
Fructose : r² = 0.1063, p = 3.62e-26 ( 999 proteins lin scale)
Glucose : r² = 0.0788, p = 1.51e-19 ( 999 proteins lin scale)
Acetate : r² = 0.2768, p = 5.65e-23 ( 303 proteins log scale)
Glycerol : r² = 0.2684, p = 1.77e-22 ( 307 proteins log scale)
Fructose : r² = 0.2718, p = 3.60e-22 ( 298 proteins log scale)
Glucose : r² = 0.2688, p = 1.38e-22 ( 308 proteins log scale)
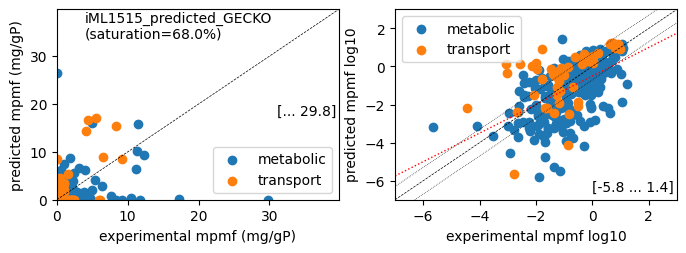
condition: Glucose
1494 proteins in model with total predicted mass fraction of 537.9 mg/gP
999 have been measured with mpmf of 514.4 mg/gP vs. 442.5 mg/gP predicted
762 metabolic proteins measured 414.0 mg/gP vs. 289.0 mg/gP predicted
237 transport proteins measured 100.4 mg/gP vs. 153.5 mg/gP predicted
495 proteins not measured vs. 95.4 mg/gP predicted
495 actual proteins 95.4 mg/gP predicted
total : r² = 0.0788, p = 1.51e-19 ( 999 proteins lin scale)
metabolic : r² = 0.0340, p = 2.92e-07 ( 762 proteins lin scale)
transport : r² = 0.4967, p = 6.70e-37 ( 237 proteins lin scale)
total : r² = 0.2688, p = 1.38e-22 ( 308 proteins log scale)
metabolic : r² = 0.3028, p = 7.92e-22 ( 258 proteins log scale)
transport : r² = 0.2613, p = 1.49e-04 ( 50 proteins log scale)
1 file(s) exported for "Load reaction data" into Escher maps
check outliers in protein correlation
The presence of issues in the model parametrization can be identified through a visual examination of protein correlation plots in both linear and log scale. Data points suspected of having issues should be queried and subsequently analyzed in detail.
[4]:
# proteins from linear protein correlation plot with poor predictions
for gene, pred in df_proteins[reference_cond].to_dict().items():
    if gene in df_mpmf.index:
        exp = df_mpmf.at[gene, reference_cond]
        if (exp < 1 and pred > 10) or (exp > 10 and pred < 1):
            description = df_proteins.at[gene, 'description']
            gname = df_proteins.at[gene, 'gene_name']
            print(f'{gene} pred {pred:8.4f} vs. {exp:8.4f}; {gname}: {description}')
b3389 pred  30.1695 vs.   0.0809; aroB: 3-dehydroquinate synthase
b1276 pred  11.4470 vs.   0.3967; acnA: Aconitate hydratase 1
b1851 pred  37.5290 vs.   0.0359; edd: Phosphogluconate dehydratase
b3737 pred  10.4876 vs.   0.0161; atpE: ATP synthase subunit c
b1136 pred   0.4634 vs.  10.5086; icd: Isocitrate dehydrogenase [NADP]
b3236 pred   0.0974 vs.  11.7189; mdh: Malate dehydrogenase
b2414 pred   0.1408 vs.  17.2441; cysK: Cysteine synthase A
b3829 pred   0.0000 vs.  29.7986; metE: 5-methyltetrahydropteroyltriglutamate--homocysteine methyltransferase
query results records of interest
The supplementary information columns present in the optimization results tables are useful for filtering records of interest.
[5]:
# check reactions catalyzed by a given gene product
df_net_fluxes[df_net_fluxes['gpr'].str.contains('b1851')]
[5]:
| reaction_str | gpr | groups | rank | mean mmol_per_gDWh | abs_mean mmol_per_gDWh | stdev | Acetate | Glycerol | Fructose | L-Malate | Glucose | Glucose 6-Phosphate | |
|---|---|---|---|---|---|---|---|---|---|---|---|---|---|
| rid | |||||||||||||
| EDD | 6pgc_c => 2ddg6p_c + h2o_c | b1851 | 37 | 4.451982 | 4.451982 | 5.054309 | 0.0 | 0.0 | 6.480902 | 0.0 | 10.151012 | 10.079977 |
visualize flux distribution on Escher maps
The predicted flux values were exported in the ‘.json’ format using the command er.save_to_escher(). Given the central carbon metabolism focal point, the subsequent step involves accessing the Escher web portal (https://escher.github.io), loading the map designated ‘Central Metabolism (iJO1366)’, and selecting ‘Data > Load reaction data’ to upload the file named ‘iML1515_predicted_GECKO_Glucose_reaction_data.json’ under ‘.:nbsphinx-math:data’ (Data > Load reaction data).
A visual inspection of the flux distribution indicates that the upper glycolytic flux appears to be inadequate, as the majority of imported glucose is directed towards the pentose phosphate pathway (PPP). To address this issue, we will adjust the turnover numbers to shift flux from the PPP to glycolysis. Additionally, we will attempt to enhance the flux distribution within the tricarboxylic acid cycle (TCA).
Step 3: Manual adjustment of model parameters
In order to improve protein predictions, we propose a redistribution of traffic flux between glycolysis and PPP. By decreasing the cost of proteins in glycolysis relative to PPP, flux can be redistributed from PPP to glycolysis. This can be achieved by increasing or decreasing the turnover numbers of selected reactions in these pathways.
First, we assess the impact of different parameter sets in memory. Once we are satisfied, we generate a new GECKO model with the modified parameters. The method of choice for modifying the turnover numbers of selected reactions in memory is EcmOptimize’s eo.scale_kcats(), which, in fact, updates the coupling factors. The turnover numbers are scaled by a factor provided in a Python dictionary; for example, the factor 2.0 will double the original turnover number. At the termination of the
optimization loop, a reversion to the original turnover numbers is facilitated by invoking the function eo.unscale_kcats(). Alternatively, when the initial scaling is executed within the context of the cobrapy model (with ecm as model:), the reversion to the original values is carried out automatically. Modifications to the turnover numbers affect the predicted growth rates, necessitating adjustments to the average enzyme saturation. This adjustment is achieved indirectly by decreasing
the total protein available, utilizing the cobrapy assignment statement model.reactions.get_by_id('V_PC_total').upper_bound to establish the upper limit of the variable ‘V_PC_total’ within the model context. The identification of a suitable set of scaling factors that enhance protein predictions is an iterative process, and the resultant set is presented below.
[7]:
# Optimize model using cobrapy and analyze results with fitted parameters
scale_kcats = {
# 1. rebalance flux between upper glycolysis and PPP
'PGI': 2.0, 'PFK_iso2': 20.0, 'FBA_iso2': 10.0, 'TPI': 20.0, 'ENO': 2.0, 'PGM_iso1_REV': 2.0,
'G6PDH2r': 0.2,
# 2. flux through usage of TCA-cycle
'PDH': 10.0, 'ACONTa_iso1': 7.0, 'ACONTb_iso1': 7.0,
'ICDHyr': 0.2, 'AKGDH': 8.0, 'SUCOAS_REV': 3.0, 'SUCDi': 8.0, 'MDH': 0.1,
# 3. fix the low predicted flux for DHQS reaction
'DHQS': 16.0/0.23,
}
# check that scale_kcats dict contains correct reaction ids
for rid in scale_kcats:
if rid not in eo.rdata:
print(f'{rid:15s} not found')
raise ValueError
# optimization loop
eo.scale_kcats(scale_kcats)
pred_results = {}
for cond, medium in conditions.items():
with ecm as model:
new_sat_level = .56
model.reactions.get_by_id('V_PC_total').upper_bound = total_protein * new_sat_level / sigma
model.medium = medium
solution = model.optimize()
if solution.status == 'optimal':
gr = solution.objective_value
pred_results[cond] = solution
print(f'{cond:25s}: pred gr: {gr:.3f} h-1 vs. exp {exp_grs[cond]:.3f}, '
f'diff: {gr - exp_grs[cond]:6.3f}')
else:
print(f'{cond} ended with status {solution.status}')
eo.unscale_kcats()
# results analysis
er = EcmResults(eo, pred_results, df_mpmf)
df_fluxes = er.collect_fluxes()
df_net_fluxes = er.collect_fluxes(net=True)
df_proteins = er.collect_protein_results()
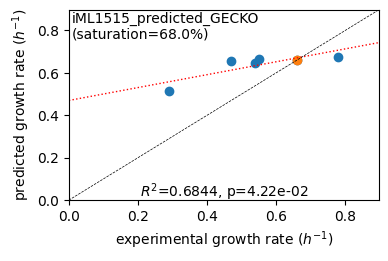
er.plot_grs(exp_grs, highlight=reference_cond)
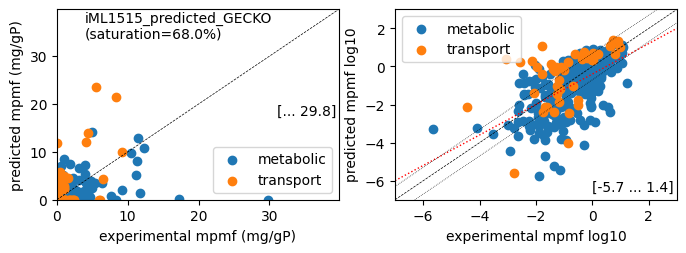
print(f'Protein mass fractions:')
er.report_protein_levels(reference_cond)
er.plot_proteins(reference_cond)
er.save_to_escher(df_net_fluxes[reference_cond], os.path.join('escher', f'{baseline_model}_adjusted'))
Acetate : pred gr: 0.513 h-1 vs. exp 0.290, diff: 0.223
Glycerol : pred gr: 0.656 h-1 vs. exp 0.470, diff: 0.186
Fructose : pred gr: 0.648 h-1 vs. exp 0.540, diff: 0.108
L-Malate : pred gr: 0.664 h-1 vs. exp 0.550, diff: 0.114
Glucose : pred gr: 0.661 h-1 vs. exp 0.660, diff: 0.001
Glucose 6-Phosphate : pred gr: 0.676 h-1 vs. exp 0.780, diff: -0.104
Protein mass fractions:
condition: Glucose
1494 proteins in model with total predicted mass fraction of 443.0 mg/gP
999 have been measured with mpmf of 514.4 mg/gP vs. 406.3 mg/gP predicted
762 metabolic proteins measured 414.0 mg/gP vs. 250.6 mg/gP predicted
237 transport proteins measured 100.4 mg/gP vs. 155.7 mg/gP predicted
495 proteins not measured vs. 36.6 mg/gP predicted
495 actual proteins 36.6 mg/gP predicted
total : r² = 0.2054, p = 9.22e-52 ( 999 proteins lin scale)
metabolic : r² = 0.2173, p = 2.22e-42 ( 762 proteins lin scale)
transport : r² = 0.4309, p = 1.36e-30 ( 237 proteins lin scale)
total : r² = 0.3335, p = 8.69e-29 ( 308 proteins log scale)
metabolic : r² = 0.3800, p = 1.33e-28 ( 260 proteins log scale)
transport : r² = 0.2661, p = 1.75e-04 ( 48 proteins log scale)
1 file(s) exported for "Load reaction data" into Escher maps
confirm flux redistribution
The updated turnover numbers have resulted in a significant redistribution of flux from the pentose phosphate pathway (PPP) to glycolysis. Predictions of protein concentration appear to be more accurate when compared to measured protein levels. Furthermore, the selection of correct isoenzymes has been confirmed, as evidenced by the observations of b3916/pfkA and b2925/fbaA.
[8]:
# analyze flux split upper glycolysis and PPP
rids = ['G6PDH2r', 'EDA', 'PGI', 'PFK', 'FBA', 'TPI', 'GAPD', 'PGK', 'PGM', 'ENO', 'PYK']

rid2genes = {}
for rid in rids:
    gpr = df_net_fluxes.at[rid, 'gpr']
    print(f'{rid:15s}: {df_net_fluxes.at[rid, reference_cond]:8.3f} mmol/gDWh [{gpr}]')
    rid2genes[rid] = re.findall(r'b\d{4}', gpr )

for rid, genes in rid2genes.items():
    for gene in genes:
        pred = df_proteins[reference_cond].get(gene, 0.0)
        if gene in df_mpmf.index:
            row = df_mpmf.loc[gene]
            exp = row[reference_cond]
            print(f'{rid:10s} {gene} pred: {pred:6.3f} exp: {exp:6.3f} mg/gP  {row["gene_name"]:4s}, '
                  f'{row["mw_Da"]/1000.0:5.1f} kDa, {row["description"][:45]}')
        else:
            print(f'{rid:10s} {gene} pred: {pred:6.3f} exp: not measured')
G6PDH2r : 3.747 mmol/gDWh [b1852]
EDA : 0.000 mmol/gDWh [b1850]
PGI : 3.949 mmol/gDWh [b4025]
PFK : 5.872 mmol/gDWh [b1723 or b3916]
FBA : 5.872 mmol/gDWh [b2097 or b2925]
TPI : 5.779 mmol/gDWh [b3919]
GAPD : 12.553 mmol/gDWh [b1779]
PGK : -12.553 mmol/gDWh [b2926]
PGM : -11.417 mmol/gDWh [b0755 or b3612]
ENO : 11.417 mmol/gDWh [b2779]
PYK : 3.173 mmol/gDWh [b1676 or b1854]
G6PDH2r b1852 pred: 5.082 exp: 0.469 mg/gP zwf , 55.7 kDa, Glucose-6-phosphate 1-dehydrogenase
EDA b1850 pred: 0.000 exp: 0.552 mg/gP eda , 22.3 kDa, KHG/KDPG aldolase
PGI b4025 pred: 1.102 exp: 1.931 mg/gP pgi , 61.5 kDa, Glucose-6-phosphate isomerase
PFK b1723 pred: 0.000 exp: 0.208 mg/gP pfkB, 32.4 kDa, 6-phosphofructokinase isozyme 2
PFK b3916 pred: 0.550 exp: 0.344 mg/gP pfkA, 34.8 kDa, 6-phosphofructokinase isozyme 1
FBA b2097 pred: 0.000 exp: 0.561 mg/gP fbaB, 38.1 kDa, Fructose-bisphosphate aldolase class 1
FBA b2925 pred: 3.404 exp: 5.353 mg/gP fbaA, 39.1 kDa, Fructose-bisphosphate aldolase class 2
TPI b3919 pred: 1.252 exp: 1.368 mg/gP tpiA, 26.9 kDa, Triosephosphate isomerase
GAPD b1779 pred: 12.812 exp: 11.410 mg/gP gapA, 35.5 kDa, Glyceraldehyde-3-phosphate dehydrogenase A
PGK b2926 pred: 5.139 exp: 11.229 mg/gP pgk , 41.1 kDa, Phosphoglycerate kinase
PGM b0755 pred: 2.195 exp: 2.348 mg/gP gpmA, 28.5 kDa, 2,3-bisphosphoglycerate-dependent phosphoglyc
PGM b3612 pred: 0.000 exp: 1.018 mg/gP gpmI, 56.1 kDa, 2,3-bisphosphoglycerate-independent phosphogl
ENO b2779 pred: 7.995 exp: 11.257 mg/gP eno , 45.6 kDa, Enolase
PYK b1676 pred: 6.622 exp: 3.080 mg/gP pykF, 50.7 kDa, Pyruvate kinase I
PYK b1854 pred: 0.000 exp: 0.666 mg/gP pykA, 51.3 kDa, Pyruvate kinase II
Step 4: Create GECKO model with adjusted parameters
Assuming that the model predictions meet our satisfaction level, the adjusted turnover numbers can be updated. Subsequently, the XBA and ECM configuration files can be updated, and the target GECKO model can be created.
[9]:
# Create updated kcats file
df_kcats = load_parameter_file(os.path.join('data', f'{baseline_model}_kcats.xlsx'))['kcats']
for rid, scale in scale_kcats.items():
df_kcats.at[f'R_{rid}', 'kcat_per_s'] *= scale
df_kcats.at[f'R_{rid}', 'notes'] = 'manually adjusted'
write_parameter_file(os.path.join('data', f'{target_model}_kcats.xlsx'), {'kcats': df_kcats})
# Create updated XBA parameter
xba_params = load_parameter_file(os.path.join('data', f'{baseline_model}_xba_parameters.xlsx'))
xba_params['general'].at['kcats_fname', 'value'] = os.path.join('data', f'{target_model}_kcats.xlsx')
write_parameter_file(os.path.join('data', f'{target_model}_xba_parameters.xlsx'), xba_params)
# Create updated ECM parameter file
ecm_params = load_parameter_file(os.path.join('data', f'{baseline_model}_ecm_parameters.xlsx'))
ecm_params['general'].at['avg_enz_sat', 'value'] = new_sat_level
write_parameter_file(os.path.join('data', f'{target_model}_ecm_parameters.xlsx'), ecm_params)
# Create GECKO model
xba_model = XbaModel(os.path.join('SBML_models', f'{fba_model}.xml'))
xba_model.configure(os.path.join('data', f'{target_model}_xba_parameters.xlsx'))
ec_model = EcModel(xba_model)
ec_model.configure(os.path.join('data', f'{target_model}_ecm_parameters.xlsx'))
ec_model.export(os.path.join('SBML_models', f'{target_model}.xml'))
1 table(s) with parameters loaded from data/iML1515_predicted_GECKO_kcats.xlsx (Thu Nov 20 18:55:42 2025)
1 table(s) with parameters written to data/iML1515_manual_adjust_GECKO_kcats.xlsx
3 table(s) with parameters loaded from data/iML1515_predicted_GECKO_xba_parameters.xlsx (Thu Nov 20 18:55:42 2025)
3 table(s) with parameters written to data/iML1515_manual_adjust_GECKO_xba_parameters.xlsx
1 table(s) with parameters loaded from data/iML1515_predicted_GECKO_ecm_parameters.xlsx (Thu Nov 20 18:55:42 2025)
1 table(s) with parameters written to data/iML1515_manual_adjust_GECKO_ecm_parameters.xlsx
loading: SBML_models/iML1515.xml (last modified: Thu Dec 5 10:03:46 2024)
3 table(s) with parameters loaded from data/iML1515_manual_adjust_GECKO_xba_parameters.xlsx (Thu Nov 20 18:58:14 2025)
22 gene product(s) removed from reactions (1494 gene products remaining)
2 attributes on reaction instances updated
extracting UniProt protein data from data/uniprot_organism_83333.tsv
1494 proteins created
1203 enzymes added with default stoichiometry
1 table(s) with parameters loaded from data/iML1515_enzyme_composition_updated.xlsx (Thu Nov 20 18:52:47 2025)
1203 enzyme compositions updated from data/iML1515_enzyme_composition_updated.xlsx
2221 reactions catalyzed by 1203 enzymes
default kcat values configured for ['metabolic', 'transporter'] reactions
1 table(s) with parameters loaded from data/iML1515_manual_adjust_GECKO_kcats.xlsx (Thu Nov 20 18:58:14 2025)
5357 kcat values updated from data/iML1515_manual_adjust_GECKO_kcats.xlsx
0 enzymes removed due to missing kcat values
1877 constraints (+0); 2712 variables (+0); 1494 genes (-22); 5 parameters (+0)
>>> BASELINE XBA model configured!
1 table(s) with parameters loaded from data/iML1515_manual_adjust_GECKO_ecm_parameters.xlsx (Thu Nov 20 18:58:14 2025)
PaxDb file E.coli - Whole organism (Integrated), year 2023, covering 3743 proteins (total 1000006.5 ppm) loaded from data/511145-WHOLE_ORGANISM-integrated.txt
modeled protein fraction of total protein mass 0.5379 g/g
1494 protein constraints to add
1494 constraint ids added to the model (3371 total constraints)
protein constraint: 306.59 mg/gDW - modeled protein
1 constraint ids added to the model (3372 total constraints)
1495 protein variables to add
1495 variable ids added to the model (7343 total variables)
3372 constraints (+1495); 7343 variables (+4631); 1494 genes (-22); 11 parameters (+6)
model exported to SBML format: SBML_models/iML1515_manual_adjust_GECKO.xml
[9]:
True
Step 5: Load and optimize GECKO model (cobrapy)
[10]:
# Load model using cobrapy
fname = os.path.join('SBML_models', f'{target_model}.xml')
ecm = cobra.io.read_sbml_model(fname)
total_protein = ecm.reactions.get_by_id('V_PC_total').upper_bound
eo = EcmOptimization(fname, ecm)
sigma = eo.avg_enz_saturation
print(f'total modeled protein: {total_protein:.2f} mg/gDW, enzyme saturation level: {sigma}')
SBML model loaded by sbmlxdf: SBML_models/iML1515_manual_adjust_GECKO.xml (Thu Nov 20 18:58:37 2025)
total modeled protein: 306.59 mg/gDW, enzyme saturation level: 0.56
[11]:
# Optimize model using cobrapy and analyze results
pred_results = {}
for cond, medium in conditions.items():
with ecm as model:
model.medium = medium
solution = model.optimize()
if solution.status == 'optimal':
gr = solution.objective_value
pred_results[cond] = solution
print(f'{cond:25s}: pred gr: {gr:.3f} h-1 vs. exp {exp_grs[cond]:.3f}, '
f'diff: {gr - exp_grs[cond]:6.3f}')
else:
print(f'{cond} ended with status {solution.status}')
# Analyze results
er = EcmResults(eo, pred_results, df_mpmf)
df_fluxes = er.collect_fluxes()
df_net_fluxes = er.collect_fluxes(net=True)
df_proteins = er.collect_protein_results()
er.plot_grs(exp_grs, highlight='Glucose')
print(f'Protein mass fractions:')
er.report_proteomics_correlation(scale='lin')
er.report_proteomics_correlation(scale='log')
print()
er.report_protein_levels('Glucose')
er.plot_proteins('Glucose', plot_fname=os.path.join('plots', f'{target_model}_proteins_Glucose.pdf'))
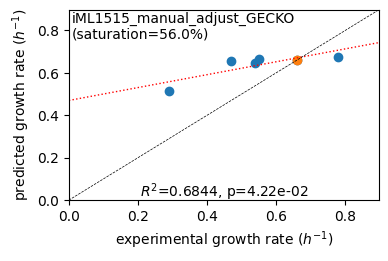
er.save_to_escher(df_net_fluxes['Glucose'], os.path.join('escher', target_model))
Acetate                  : pred gr: 0.513 h-1 vs. exp 0.290, diff:  0.223
Glycerol                 : pred gr: 0.656 h-1 vs. exp 0.470, diff:  0.186
Fructose                 : pred gr: 0.648 h-1 vs. exp 0.540, diff:  0.108
L-Malate                 : pred gr: 0.664 h-1 vs. exp 0.550, diff:  0.114
Glucose                  : pred gr: 0.661 h-1 vs. exp 0.660, diff:  0.001
Glucose 6-Phosphate      : pred gr: 0.676 h-1 vs. exp 0.780, diff: -0.104
Protein mass fractions:
Acetate : r² = 0.0895, p = 4.31e-22 ( 999 proteins lin scale)
Glycerol : r² = 0.0838, p = 9.63e-21 ( 999 proteins lin scale)
Fructose : r² = 0.2062, p = 5.73e-52 ( 999 proteins lin scale)
Glucose : r² = 0.2054, p = 9.22e-52 ( 999 proteins lin scale)
Acetate : r² = 0.2912, p = 4.52e-24 ( 300 proteins log scale)
Glycerol : r² = 0.3015, p = 5.08e-25 ( 300 proteins log scale)
Fructose : r² = 0.3129, p = 9.11e-26 ( 296 proteins log scale)
Glucose : r² = 0.3335, p = 8.69e-29 ( 308 proteins log scale)
condition: Glucose
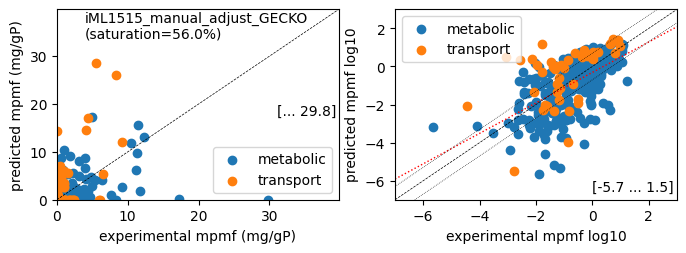
1494 proteins in model with total predicted mass fraction of 537.9 mg/gP
999 have been measured with mpmf of 514.4 mg/gP vs. 493.4 mg/gP predicted
762 metabolic proteins measured 414.0 mg/gP vs. 304.3 mg/gP predicted
237 transport proteins measured 100.4 mg/gP vs. 189.0 mg/gP predicted
495 proteins not measured vs. 44.5 mg/gP predicted
495 actual proteins 44.5 mg/gP predicted
total : r² = 0.2054, p = 9.22e-52 ( 999 proteins lin scale)
metabolic : r² = 0.2173, p = 2.22e-42 ( 762 proteins lin scale)
transport : r² = 0.4309, p = 1.36e-30 ( 237 proteins lin scale)
total : r² = 0.3335, p = 8.69e-29 ( 308 proteins log scale)
metabolic : r² = 0.3800, p = 1.33e-28 ( 260 proteins log scale)
transport : r² = 0.2661, p = 1.75e-04 ( 48 proteins log scale)
1 file(s) exported for "Load reaction data" into Escher maps
[12]:
# analyze reactions selected fluxes
rids = ['G6PDH2r', 'EDA', 'PGI', 'PFK', 'FBA', 'TPI', 'GAPD', 'PGK', 'PGM', 'ENO', 'PYK']
for rid in rids:
    print(f'{rid:15s}: {df_net_fluxes.at[rid, reference_cond]:8.3f} mmol/gDWh [{df_net_fluxes.at[rid, "gpr"]}]')
G6PDH2r        :    3.747 mmol/gDWh [b1852]
EDA            :    0.000 mmol/gDWh [b1850]
PGI            :    3.949 mmol/gDWh [b4025]
PFK            :    5.872 mmol/gDWh [b1723 or b3916]
FBA            :    5.872 mmol/gDWh [b2097 or b2925]
TPI            :    5.779 mmol/gDWh [b3919]
GAPD           :   12.553 mmol/gDWh [b1779]
PGK            :  -12.553 mmol/gDWh [b2926]
PGM            :  -11.417 mmol/gDWh [b0755 or b3612]
ENO            :   11.417 mmol/gDWh [b2779]
PYK            :    3.173 mmol/gDWh [b1676 or b1854]
(Optional) Track progress
[13]:
import scipy
import numpy as np

number = 4
xy = np.array([[df_mpmf.at[gene, reference_cond], df_proteins.at[gene, reference_cond]]
                for gene in df_proteins.index if gene in df_mpmf.index])
log10_x, log10_y = er.get_log10_xy(xy)
lin_pearson_r, _ = scipy.stats.pearsonr(xy[:, 0], xy[:, 1])
log_pearson_r, _ = scipy.stats.pearsonr(log10_x, log10_y)

predictions = load_parameter_file('protein_predictions.xlsx')
data = [[number, target_model, lin_pearson_r**2,log_pearson_r**2, len(xy), len(log10_x)]]
cols = ['No', 'model', 'lin r2', 'log r2', 'lin proteins', 'log proteins']
df = pd.DataFrame(data, columns=cols).set_index('No')
if number in predictions[reference_cond].index:
    predictions[reference_cond].drop(index=number, inplace=True)
predictions[reference_cond] = pd.concat((predictions[reference_cond], df)).sort_index()
write_parameter_file('protein_predictions.xlsx', predictions)
predictions[reference_cond]
1 table(s) with parameters loaded from protein_predictions.xlsx (Thu Nov 20 18:56:40 2025)
1 table(s) with parameters written to  protein_predictions.xlsx
[13]:
| model | lin r2 | log r2 | lin proteins | log proteins | |
|---|---|---|---|---|---|
| No | |||||
| 1 | iML1515_default_GECKO | 0.033244 | 0.190225 | 1018 | 299 |
| 2 | iML1515_modified_GECKO | 0.135981 | 0.201613 | 999 | 322 |
| 3 | iML1515_predicted_GECKO | 0.078803 | 0.268769 | 999 | 308 |
| 4 | iML1515_manual_adjust_GECKO | 0.205413 | 0.333470 | 999 | 308 |
Closing remarks
By manually adjusting the turnover numbers of seven reactions in glycolysis and the PPP, a substantial flux shift from the PPP to glycolysis can be achieved, thereby enhancing the predictions of protein concentrations in these pathways. Consequently, the overall correlation between predicted and measured protein concentrations has been shown to improve. The adaptation of enzyme-related parameters to known flux distributions and proteomics data emerges as a promising approach to refine our model.
In the subsequent tutorial, we will proceed to enhance our GECKO model through the implementation of an automatic fitting process.
(Alternative) gurobipy - manual parameter fitting
The manual fitting of model parameters using the gurobipy interface is nearly equivalent to the modifications applied using cobrapy. However, it should be noted that model contexts are not supported using the gurobipy interface. Consequently, it is necessary to explicitly revert model modifications at the termination of the optimization loop. The function eo.set_variable_bounds() updates variable bounds and is employed to modify the total available protein. Consequently, at the termination
of the loop, it is necessary to reset the total protein using the aforementioned function. The update of turnover numbers and the creation of the target GECKO model have been demonstrated at step 4 above.
[14]:
# Load model using gurobipy
fname = os.path.join('SBML_models', f'{baseline_model}.xml')
eo = EcmOptimization(fname)
total_protein = eo.get_variable_bounds('V_PC_total')['V_PC_total'][1]
sigma = eo.avg_enz_saturation
print(f'total modeled protein: {total_protein:.2f} mg/gDW, average saturation level: {sigma}')
SBML model loaded by sbmlxdf: SBML_models/iML1515_predicted_GECKO.xml (Thu Nov 20 18:56:05 2025)
LP Model of iML1515_GECKO
7343 variables, 3372 constraints, 28438 non-zero matrix coefficients
total modeled protein: 306.59 mg/gDW, average saturation level: 0.68
[15]:
# Optimize model using gurobipy with modified parameters

scale_kcats = {'PGI': 2.0, 'PFK_iso2': 20.0, 'FBA_iso2': 10.0, 'TPI': 20.0, 'ENO': 2.0, 'PGM_iso1_REV': 3.0}
for rid in scale_kcats:
    if rid not in eo.rdata:
        print(f'{rid:15s} not found')
        raise ValueError

new_sat_level = .56
orig_bounds = eo.set_variable_bounds({'V_PC_total': (None, total_protein * new_sat_level / sigma)})
eo.scale_kcats(scale_kcats)

pred_results = {}
for cond, medium in conditions.items():
    eo.medium = medium
    solution = eo.optimize()
    if solution.status == 'optimal':
        pred_results[cond] = solution
        gr = solution.objective_value
        print(f'{cond:25s}: pred gr: {gr:.3f} h-1 vs. exp {exp_grs[cond]:.3f}, diff: {gr - exp_grs[cond]:6.3f}')
    else:
        print(f'{cond} ended with status {solution.status}')

eo.unscale_kcats()
if orig_bounds:
    eo.set_variable_bounds(orig_bounds)

er = EcmResults(eo, pred_results, df_mpmf)
df_fluxes = er.collect_fluxes()
df_net_fluxes = er.collect_fluxes(net=True)
df_proteins = er.collect_protein_results()
er.plot_grs(exp_grs, highlight=reference_cond)

print(f'Protein mass fractions:')
er.report_protein_levels(reference_cond)
er.plot_proteins(reference_cond)
er.save_to_escher(df_net_fluxes[reference_cond], os.path.join('escher', f'{baseline_model}_adjusted'))
Acetate                  : pred gr: 0.368 h-1 vs. exp 0.290, diff:  0.078
Glycerol                 : pred gr: 0.570 h-1 vs. exp 0.470, diff:  0.100
Fructose                 : pred gr: 0.559 h-1 vs. exp 0.540, diff:  0.019
L-Malate                 : pred gr: 0.568 h-1 vs. exp 0.550, diff:  0.018
Glucose                  : pred gr: 0.574 h-1 vs. exp 0.660, diff: -0.086
Glucose 6-Phosphate      : pred gr: 0.596 h-1 vs. exp 0.780, diff: -0.184
Protein mass fractions:
condition: Glucose
1494 proteins in model with total predicted mass fraction of 443.0 mg/gP
      999 have been measured with mpmf of  514.4 mg/gP vs. 374.7 mg/gP predicted
           762 metabolic proteins measured 414.0 mg/gP vs. 239.8 mg/gP predicted
           237 transport proteins measured 100.4 mg/gP vs. 134.9 mg/gP predicted
      495 proteins not measured vs.  68.3 mg/gP predicted
           495 actual  proteins      68.3 mg/gP predicted
total           : r² = 0.1419, p = 4.97e-35 ( 999 proteins lin scale)
 metabolic      : r² = 0.0980, p = 8.58e-19 ( 762 proteins lin scale)
 transport      : r² = 0.4748, p = 1.02e-34 ( 237 proteins lin scale)
total           : r² = 0.2961, p = 6.63e-25 ( 305 proteins log scale)
 metabolic      : r² = 0.3397, p = 1.35e-24 ( 255 proteins log scale)
 transport      : r² = 0.2675, p = 1.20e-04 (  50 proteins log scale)
1 file(s) exported for "Load reaction data" into Escher maps
[16]:
# analyze reactions selected fluxes
rids = ['G6PDH2r', 'EDA', 'PGI', 'PFK', 'FBA', 'TPI', 'GAPD', 'PGK', 'PGM', 'ENO', 'PYK']
for rid in rids:
    print(f'{rid:15s}: {df_net_fluxes.at[rid, reference_cond]:8.3f} mmol/gDWh [{df_net_fluxes.at[rid, "gpr"]}]')
G6PDH2r        :    4.229 mmol/gDWh [b1852]
EDA            :    0.000 mmol/gDWh [b1850]
PGI            :    4.951 mmol/gDWh [b4025]
PFK            :    7.271 mmol/gDWh [b1723 or b3916]
FBA            :    7.271 mmol/gDWh [b2097 or b2925]
TPI            :    7.190 mmol/gDWh [b3919]
GAPD           :   15.569 mmol/gDWh [b1779]
PGK            :  -15.569 mmol/gDWh [b2926]
PGM            :  -14.582 mmol/gDWh [b0755 or b3612]
ENO            :   14.582 mmol/gDWh [b2779]
PYK            :    3.227 mmol/gDWh [b1676 or b1854]
References
Araiza-Olivera, D., Chiquete-Felix, N., Rosas-Lemus, M., Sampedro, J. G., Peña, A., Mujica, A., & Uribe-Carvajal, S. (2013). A glycolytic metabolon in Saccharomyces cerevisiae is stabilized by F-actin.
[ ]: